Overview
After tracking all of the data over the month of November from each of the games and generating the game level stats and charts from my last article (found here). I was able to use them to generate team level stats from tries scored linebreaks or turnovers.
I simply want to share those stats that I tracked here. Some useful, some probably less so. Some can be found in other places, tries, turnovers, I'm sure. However, I think I'm the only one who has "easily accesible" (for me at least) stats like offloads in certain phases, or even gainline%. Obviously these all being team level stats, they don't tell much about any individual players, and are dependent on selection for each game. Then of course each team played a different schedule, so these stats are all relative to who the opponents each team had. Then finally, some of these may not be able to tell us who is good or not, but a lot can be used to tell style of play, and what couls/should be done to attack or defend other teams. I am going to start with the most basic stats, then move on to the more interesting stuff, to me at least. Then I want to discuss more of the pros and cons of this project, from my perspective, and what I want to continue and not continue tracking now that I have experience doing this.
Results
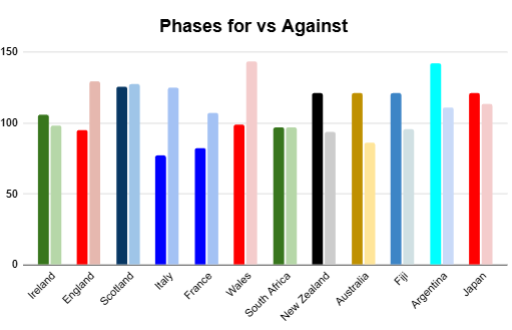
I watched every single Autumn Nations series game this fall, between two tier 1 nations, and want to share all of the charts that resulted from those stats. I know I'm (very) late getting this out, but I've been busy this week and wanted to put some effort into my write ups and all of the charts to get those out first (here). So here is the first chart, simple tries scored:
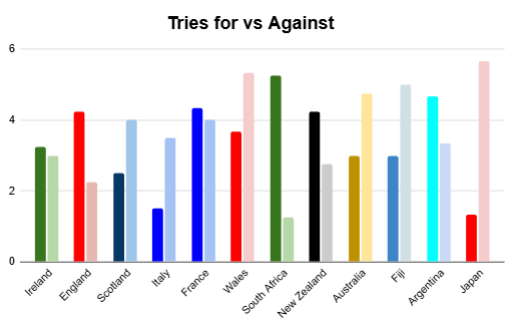

Obviously, these, as are all of the first stats are adjusted per game because teams like Ireland played 4 games but Scotland only played 2 (tracked). Just going team by team here, Ireland makes sense to be where they'er at, they dominated two clearly lesser opponents and got dominated by two clearly superior opponents in an up and down series. They are clearly no longer the perfect well-oiled machine they were heading into 2023. England had a great autumn, scoring 4 tries a game and only giving up two. Their blutz defense is brutal to get around and their kicking game leading to their attack is almost unbeatable. Scotland's 2 games were underwhelming, those last few tries against Arg and the DMack one really ruined some incredible defensive stands in the remaining ~120 mins of rugby. Italy beat Aus, and hung with South Africa but relied heavily on kicking pens to hang in those games. France at just over 50% is surprising to me as well. Obviously the South Africa game they struggled, but they controlled the games against Fiji and Australia. Wales and Japan both had very poor defenses that got overpowered a lot, but both also played very tough schedules, except against each other. Wales was at least able to fire mroe shots against the All Blacks and Argentinca than Japan against Ireland. Though I'm sure the South Africa game would make Wales' totals look MUCH worse. Speaking of South Africa, what else is there to say, most tries for, least against, around 80% tries for percentage, just insane. Their defense is suffocating and their atack can be both physically punishing or quick and explosive. New Zealand looks good but is skewed a bit by the Wales game, I'm sure. Don't think their fans will be happy about where they stand, but they have one of the most prolific try scoring back lines, when it clicks. Australia just wasn't good this autumn, played too much, and they don't have the depth. Fiji chuck the ball around and score a good amount and pushed England and France a bit, but not enough to really make them sweat, as they gave up many more tries than they scored. Finally, Argenia had some wildly impressive attacking series. However they shut off mentally on defense a few times, and some of their offense is skewed by playing Wales.
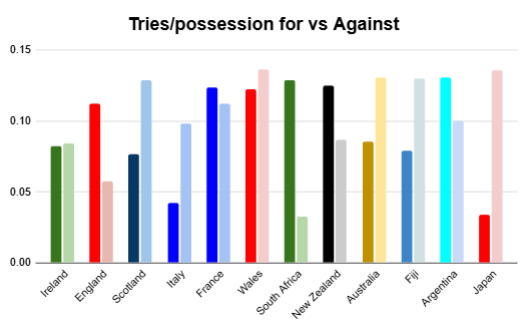
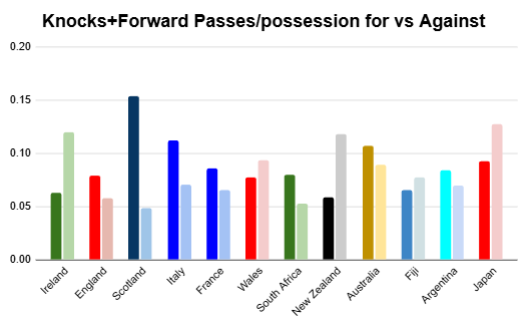
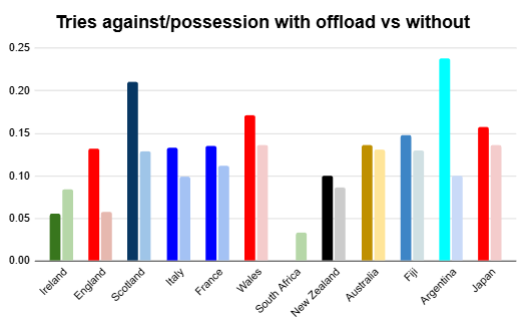
Now I also looked at tries per possession, for and against to see which teams were more or less effecient. Japan still got ran through and struggled to get anything going on attack, but Wales was one of the most opportunistic teams in the series. England and South Africa leading the way defensively, still stiffling opponents with their blitz defenses. Most of the other stats seem to be relatively tightly packed together, which tell me that at the professional level, the more important thing is possession. Sure the best teams may have a little bit higher strike rate than the worst teams, but the differences between this chart and the one above can be explained by number of possesions, and the one above varied much more wildly. Now of course you also need possession in a reasonable attacking location. Even the best teams won't score if they attack out from their own try line every single possesion. Then Italy of course still barely scored.
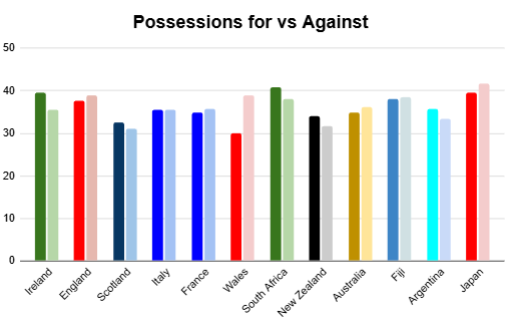
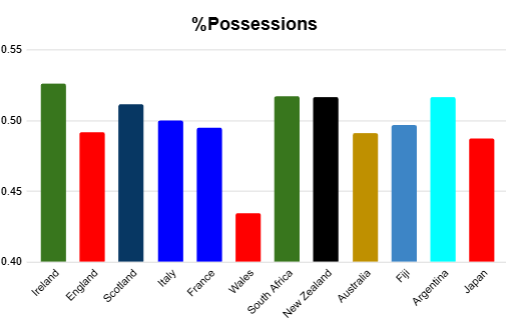
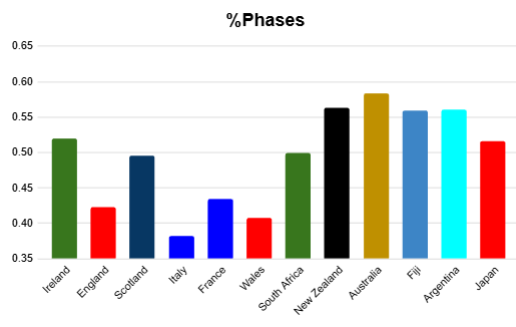
Next, looking at possesions, they do tend to remain somewhat close to 50/50. Obviously if you score a try you get possesion right back, but I also counted each new lineout/scrum as a new possesion, so if a team won an attacking penalty, kicked for corner and won the next line out, they would get 2 possesions for that (1 for the possesion before the attacking pen, and 1 for the new one after the lineout). Then there is of course Wales, all the way down at a bit over 40%, while the leader, Ireland is not even at 55%. And those two teams didn't even play each other!
Now looking at a more granular level than possesions, the number of phases teams ran per game. South Africa not that high because they score so effeciently. Especially against Ireland they would just win scrum pens and score on first phase. Then teams are constantly chasing them so they "give up" a lot of phases because teams need to try and run phases to catch up. Japan and Argentina also really wanted to run a ton of phases in general because they Japan like playing fast and running as many phases as they can, and I just don't think Argentina liked kicking. Plus they had to chase the game vs Scotland and run throught the phases. England being that much higher than Scotland and France surprised me. I feel like Scotland while coming back against New Zealand had to run a ton of phases, and England loved to kick quick. But then again after they kicked, they tended to regather their kicks then run through phases quickly after that. This is definately a more contextual stat that tells what teams wanted to do a lot, or how much they had to chase the game. Obviously they still have to be succesful at running through those phases, but most professional teams don't turn the ball over if they're just running simple 1 off runners that aren't either gaining a lot of meters or losing a lot of meters.
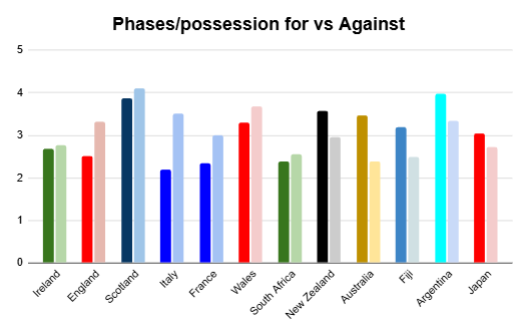
In terms of phases per possesion this really shows that South Africa was incredibly effecient. Fiji being near the top and France being near the bottom surprise me. I guess France was effecient and would kick quickly to try and get LBB to chase it if they weren't getting anything going. My initial thought was they don't run a ton of phases because they both kept the ball alive a lot by throwing offloads instead of setting a ruck and another phase. New Zealand did love to chuck the ball around a ton, especially against Wales. But they were at least trying a lot of things. Meanwhile Australia, right next to them also ran a lot of phases per possession, but they tended to just pass the ball out aimlessly and hit a lot of one off crash runners and generally would be going backwards gradually.
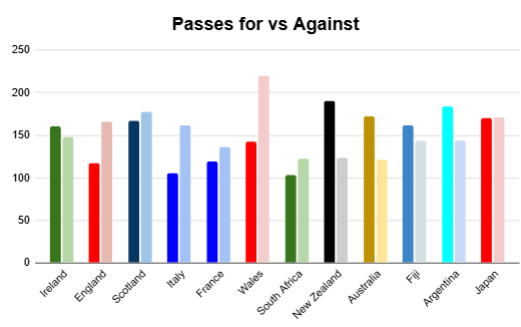
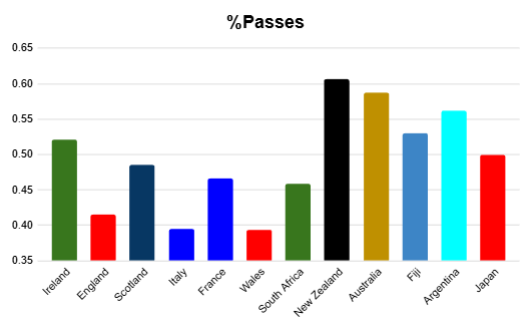
Then in terms of passes, which I feel like is kind of a measure of "excitement" more than anything. Not that I don't find England's kicking game incredibly exciting, I would hope I've made it abundantly clear that I do. But New Zealand chucks the ball around a ton, especially in that Wales game, and they're generally exciting to watch, baring that Ireland game that was just a complete mess overall. Meanwhile South Africa relied a lot on power dominance then running one or two really nice strike plays. Impressive to watch and analyze after, but not edge of your seat anticipatingly exciting. Ireland I wouldn't have expected to be that high, but then again they never really get the ball out wide in one big long skip ball or kick pass. It is always just through the hands with forwards and backs linking up to tap the ball along. Kind of impressive to watch, however it is definately slower and a lot of the runners aren't running threatening lines so they allow the defense to get ouside and swallow them up. Scotland and Argentina throwing that many passes interests me, I don't really remember either of them throwing the ball around a ton, but they must have. I suppose it's a byproduct of running a lot of phases per possesion. Then you have Wales, poor Wales. They faced over 200 passes a game on average, gave up over 1000 running meters to both Japan and New Zealand, and didn't have a ton of ball in hand time themselves. They had to just be shattered after those games and constantly defending new looks and on the back foot. Then their other game, Argentina also passes the ball around a ton, so of course Wales faced far and away the most passes. Also the North/South divide in interesting. Ireland the only team from the North to throw more than 50% of the passes, and South Africa the only team to throw less.
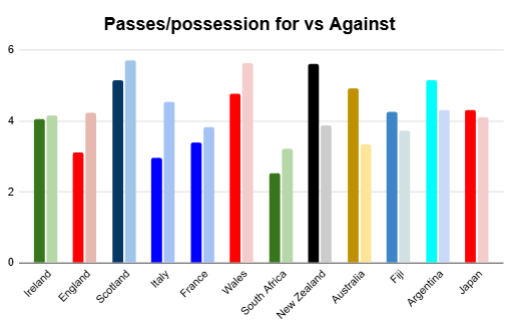
Per possesion is largely a function of just how many phases a team ran per possession. New Zealand is further up top though, which tells me that they ran a lot more complex plays when attacking as a percentage of overall phases. Wales is also up there, which is a promising sign in my opinion. Not that it is bad to have very low pass counts, see South Africa and England, but having high pass counts tells me they are at least firing shots and trying things when they can. I would rather a bad team lose by 35 while scoring 4 tries than lose by 25 but get nilled. Obviously if you build to a strategy like England or South Africa where you can be incredibly optimistic and capitalize on any mistake by your opponents, or just have 1 aspect of your game that is so much better than everyone else (England's kicking, South Africa's power), you can play fewer phases and have something to fall back on. But Wales or Scotland don't really have anything to fall back on, so they had to try and beat opponents by out manuevering them with the ball in hand. Obviously that is more risky, sometimes you win big, sometimes New Zealand loses to England, but I think that is a better base to have than trying to build up from low pass count into a more expansive game. We're seeing how South Africa has struggled to expand their game a bit, and they've been working on that for this whole cycle, and already had the best base and power game in the world to fall back on. Italy is another one who makes sense where they're at. They played an incredibly opportunistic game, in tight grinding out meters where they could and taking the points at every single opportunity they could.
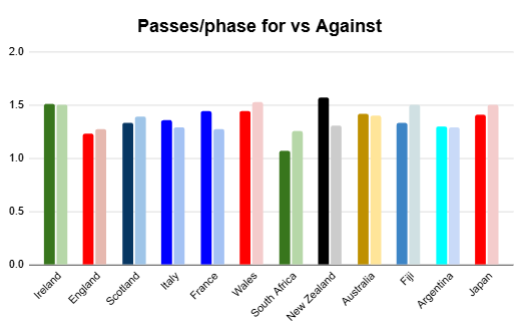
Finally, passes per phase. New Zealand and Ireland don't shock me being this high, New Zealand just loves a good pass, and potentially have the best ball handling in the world. Then Ireland loves their intricate plays with multiple passes and strike runners and whatnot. Then South Africa is way down there just running the ball down your throat, barely over 1 pass per phase. They also love a box kick, vs a team like Japan who would almost always pass the ball to a 10 or 15 before kicking. I'm not sure how much that skews things, but I would imagine having a lot of 0 pass phases vs 1 pass phases makes a noticeable difference. The rest of the teams were all just in and around the 1.3 to 1.4 passes per phase range. I would have expected Fiji to be higher, but other than that I guess it makes sense. Also interesting to see that most phases only have 1.5 passes. Even removing kicks, the pass count is still probably under 2. Power game and winning collisions on the gainline is still and incredible important part of this game.
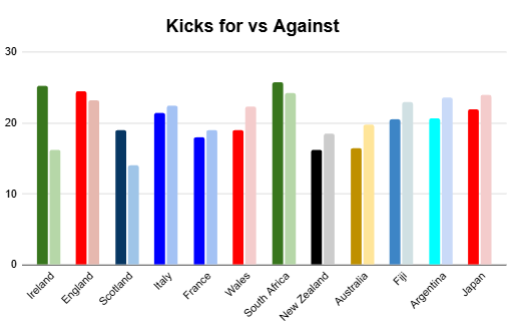
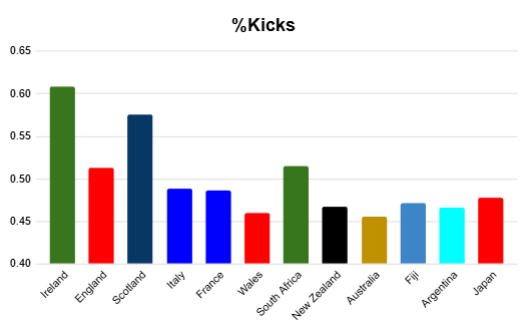
South Africa, England, and Ireland being the top 3 for kicks for is unsurprising, nor are England and South Africa hovering around 50% of total kicks, but Irealand remaining way up there. England and South Africa almost always kick contestably, and hang high balls that they want teams to return or be forced to kick back after a few phases. Meanwhile, Ireland loves to kick long and out, just giving the other team possession without chance for a return kick imenently. Also, England and South Africa's kick chase are absolutely world class and force opponents to either turn the ball back over 30 meters upfield, or kick it back and hope to regain some territory. Meanwhile, Ireland can't pressure like that so they either get sucked into direct kicking battles (no phases ran so didn't track them unless a pass or tackle was made) or just let the other team run it back. Wales facing a ton of high balls is unsurprising. It was one of the biggest stories of November I feel like, how much Blair Murray struggled under the high ball, so every team peppered him with kicks, except New Zealand. Shown by New Zealand being at the bottom of the kicks and the fact that they ran the ball a ton against Wales. Scotland facing hardly any kicks is weird to me. Obviously Kinghorn is a great full back, but Duhan really struggled defending kicks for the Lions, but neither Argentina nor New Zealand really wanted to try that again. Though I suppose this shows a big divide between the 6 nations sides and the TRC sides. Aside from South Africa, and Wales, who I already discussed, the 6 nations sides all kicked a noticeably higher percent than their southern hemisphere opponents. I can't speak for much southern hemisphere punditry, but in the north territory is often talked about as the key factor, and wanting to kick away the ball quickly. Or of course people complaining about teams kicking the ball away too much. Also interesting to note that South Africa plays the most "European style" of rugby with lots of kicks and lower passes and phases, and also play their club rugby in Europe. The stylistic differences between them and New Zealand are vat, which I guess makes them great rivals considering how successful they both have been with their differing skills and tactics.
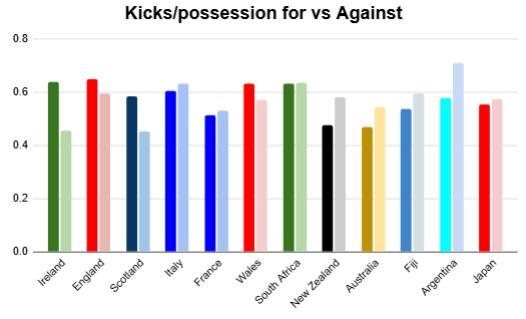
We see similar results in kicks per possesion, which isn't shocking. England and South Africa love a good kick. Ireland love to end possesions with a kick. New Zealand and Australia try to avoid kicking as much as possible. Wales while they tried a lot in attack, were largely unsuccesful and would have to kick it off. Interesting that they faced way more kicks than they made, but per possesion kicked the ball away more than they received it. This just exemplifies how poor they were under the high ball, their opponents were able to regather kicks and maintain possesion so often when playing Wales. Also, as noted by that, and England's kick chase, not every kick ends a possesion, but a lot of them do. I don't have specific numbers on this, but probably 50% of possesions end in a kick, which makes sense. A lot of these games started cagey and tight with a few phases of just kicks back and forth. But then as soon as one team gained an advantage they would pressure it until they lost a lot of possesion. Either turning it over and giving up a line break, or scoring. The games opened up a ton between the 10th and 20th minutes often.
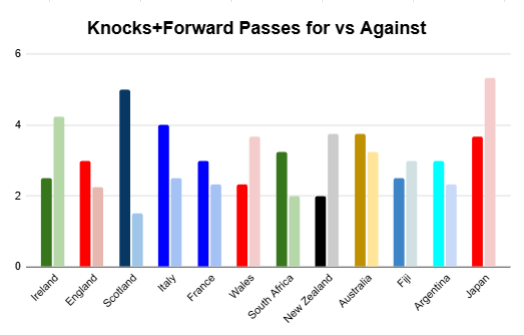
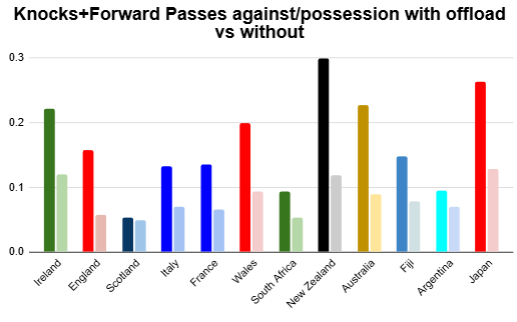
Moving on from possesion, I wanted to look at how possesions tended to end, knocks or forward passes, turnovers or penalties lost, or penalties won (or tries of course, but I already covered that). Jesus Scotland almost 5 knocks per game! And this doesn't even include the 3 times they were held up vs New Zealand, so they'd be well over 6 "skill based" turnovers per game if I included those. Really not ideal. Also what happened with Japanese games, why was everybody knocking the ball on so much against them. Not scared of the scrum so they tried more daring passes or something? I know Ireland was rather sloppy that game, but their ~2 knocks per game is a respectable total. I guess that would explain South Africa having the lowest amount of knocks against aside from Scotland. Nobody wants to scrum against them, so they play more in tight, cautious rugby. That then makes it easier to defend and shoot up knowing they won't risk an offload or riskier pass under pressure. That in turn pressures the offense more into keeping the ball in tight in a vicious cycle that results in South Africa giving up a try per game, less than thet if you include the Wales game I didn't. Also, all of these numbers seem low because I was only tracking "handling errors" in phase play. If a team knocked on a kick or kick chase, I didn't count it. Similarly, if a team knocked on a ball going for an intercept, or in a lineout or something, I also didn't count that, unless it also was a penalty, in which case I marked it as an attacking pen or turnover. Also, I only looked at the "result" of the possesion for knocks/penalties. For example, if a team threw a forward pass, but before they could regather, the other team just picked up the ball and won possesion back I marked it as a turnover, not a forward pass. I only marked it as a forward pass or knock on when the scrum was called, or halftime/the end of the game occured.
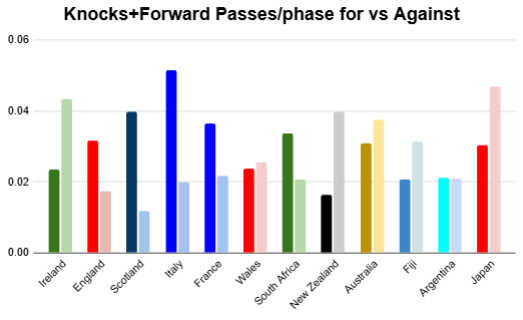
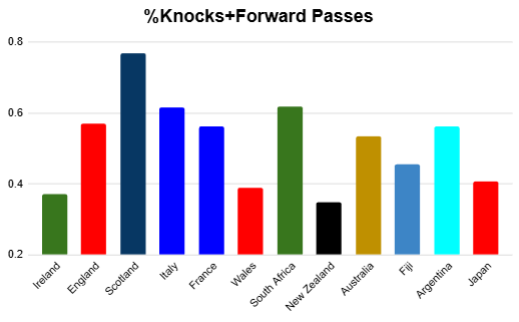
Scotland still looks terrible when you look at knocks on per possesion, with 15% of their possesions ending in a scrum for the opposition, but then you remember that they run more phases per possession than anyone else, and don't look as bad when you take that into account. There is still the risk in running more phases, leading to the opposition getting the ball, but if they end up giving up more knocks than pens, I suppose that's generally better, especially considering their scrum was solid this autumn, even without Fagerson vs the ABs. Compared the the ABs is funny. Obviously they have a lot of impact on each other because they played each other, and that was one of Scotland's two games, but still. The ABs ending only ~5% of their possesions with a knock or forward pass and having over 10% of their opponents possesions end that way vs 15% and 5% repectively. Speaking of the All Blacks, this again shows that they probably have the best ball handling of any team in world rugby, just incredibly smooth with it in terms of per possesion or per phase, they very rarely knock the ball on. And at least a few of their knock ons or forward passes were tries TMOed for forward passes in the buildup I believe, particularly against Wales they had 2 or 3 in a row chalked off. In terms of per phase, you still see some similar trends. Everybody is knocking the ball on vs Japan, and nobody wants to knock the ball on vs the Boks. But then there are a lot of differences. The Italians knocked the ball on a ton per phase. England also knocked the ball on a ton, and teams knocked the ball on a lot vs Ireland. But again, neither of those are shocking. England doesn't run that many phases that aren't kicks, and when they do they're usually trying something aggressive. They also aren't afraid of a scrum anymore with the development of Heyes, Baxter, and of course Genge and Stuart giving them two sets of very solid international props. Also, Fiji has impressive ball handling considering how much they tend to do with it interms of offloads, and relatively high phase counts.
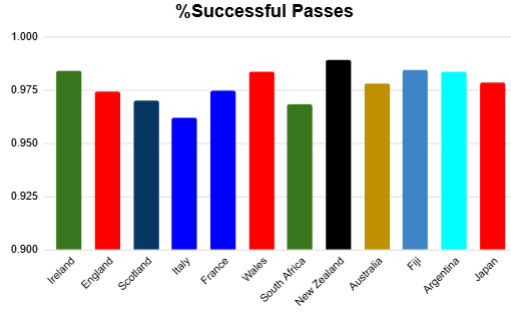
Now bringing it all together and looking at what percent of passes were "successful"*. We see Italy knocking and Scotalnd as two of the worst teams in terms of succesful passes. But then South Africa is also down there, but then again they are really not afraid of a scrum, so they don't care if they knock it on. Then we see New Zealand and Fiji at the top. Great ball handling from both of them. Ireland is also up there, but they play a much more conservative game with ball in hand making the simple passes and not trying anything that is too likely to lead to an oppositon scrum. Not just against South Africa, that was in all of their games aside from the New Zealand game which, as I've said many times was just a mess in general.
*Successful passes meaning simply passes that weren't knocks or forwards passes. I didn't track passes that didn't go to hand or got intercepted. However there were very few passes that did get intercepted, and it seems like the only teams that were scrambling back to get passes that didn't go to hand were Wales and Australia, though that is just me purely speculating/guessing based off memories of games I watched weeks ago.
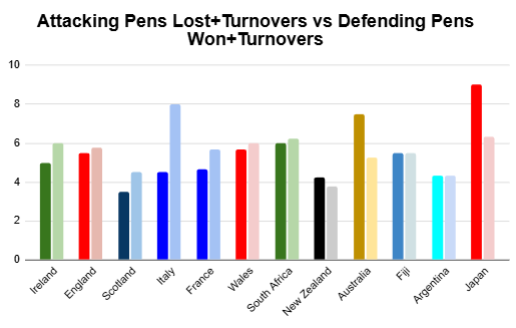
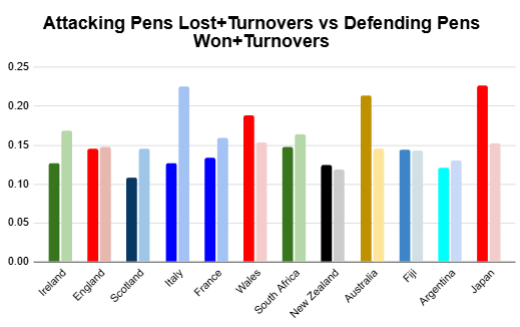
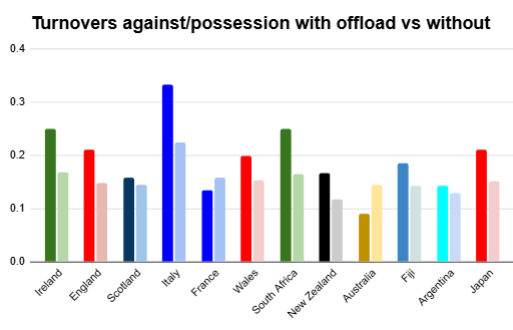
Now looking at the other negative way an attacking possesion could end, penalties or turnovers. I just labeled them the same when I was tracking data, because I figured they were "equally punishing". Either just giving the team a linout 30+ meters downfield, which they're not guarenteed to regather of course. Or give them a free broken field attacking play. Maybe in terms of how bad they are that's similar, but I feel like the feeling is incredibly different between the two. A broken field attack usually leads to more chaos and either a try or break one way, or another turnover and broken field attack the other way. Then a penalty to a lineout feels like the team is slowing down and suffocating the other team, assuming they can win their lineouts. Scotland, New Zealand, and Argentina were quite good at this. I already discussed New Zealand's ball handling skills, but they also have very good support lines so that they don't give up turnovers or holding on penalties often. Similarly Scotland was able to run more phases per possesion partially because they weren't turning the ball over. Which as I mentioned earlier is probably a good thing I suppose. I would rather give the opponent a scrum where I am than a lineout further downfield or chance to attack a defense that isn't set. Then Argentina played well, they obviously have some great attacking talents in their back line, but also under Contipomi have been developing a nice system to use said attacking talents. Japan and Australia being way up at the top here is also unsurprising to me. Japan ran so many phases so quickly that players would get isolated without support but still receive the ball because they were the only ones left in a good attacking position but would give a clean jackal opportunity to the opposition. Italy winning a ton of defending penalties and turnovers surprised me, but that is where a few of their points came from against Australia. Just kick it long and then wait for them to make a mistake and as soon as they get pinged for holding on or an illegal clearance you take the 3 points.
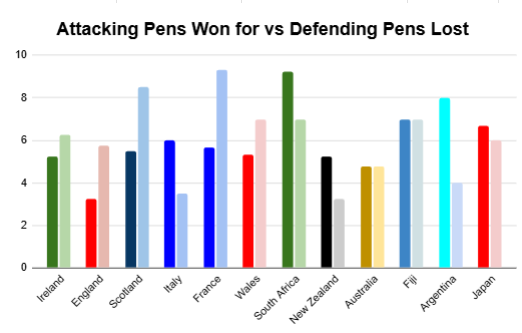
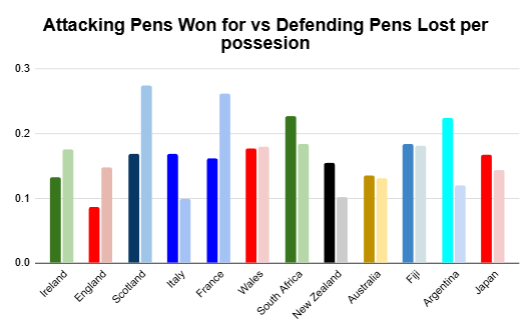
Now looking at the opposite, penalties won while on attack vs penalties conceeded while defending. South Africa unsurprisingly on top here. They are just so good at grind a team down phase after phase until you either have to go offsides or do something cynical in the ruck to slow them down. Once again, I only tracked penalties that were blown, so if they scored with an advantage, or won 3 penalties on the same possession, those didn't get added to the total or only counted as one. France looks bad mostly because of that South Africa game I would imagine. Similarly Scotland and the Argentina game because while the All Blacks had some incredible discipline this series, they also didn't win that many penalties. Ireland also doesn't look as bad as they probably should because if South Africa didn't play the advantage from the scrum pens they won I didn't track it. That was such an odd situation that I wasn't really prepared for what to do when tracking it. England not winning many penalties is kind of surprising, but I guess their strategy doesn't lend itself well to winning penalties. If you looked at knock ons forced from kicking high balls, or breaks made from regathering high balls I'm sure they would be way up there. Or even pens won from the breakdown after a kick, because they won a few of those, but I didn't mark them as attacking pens. Then in terms of pens won per possesion we see similar results, South Africa on top, England way at the bottom with Argentina also near the top. However, it is interesting to note that between 10 and 20% of all possesions end in an attacking penalty. Around 30-35% of possesions ending in a penalty either way as well. Assuming that most of the turnovers/attacking pens lost were in fact attacking pens lost becuase players often choose to hold on to the ball or attempt an illegal clear out in hopes they don't get pinged instead of giving up the turnover. My naive assumption would have been those would be much lower, around 5-10% each, with the total amount of possessions ending in penalties remaining under 20%. Instead there were a lot more attacking pens. That shows how hard it is to take possesion of the ball wihtout sacraficing a ton of territory on the receivng end of a kick. And why elite jackal threats will always have a place in the game, winning an extra turnover or two a game could totally swing the momentum and give your team an edge just as much as a gamebreaking winger or pinpoint kicking half back.
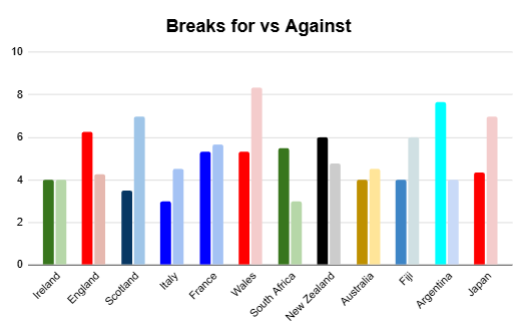
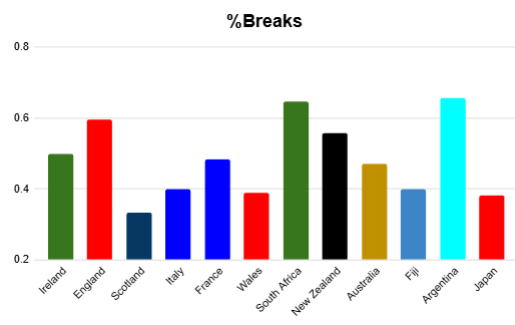
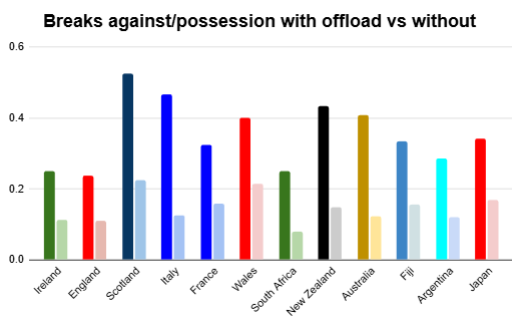
Looking at breaks is an interesting one. Linebreaks are an official stat tracked, I believe, but after having done this, they are such a nebulous event that I think 50 different people could track linebreaks and give 50 different numbers. Initially I tried determining between half breaks where someone would break a tackle but then get caught up to a bit later, or get 15-20 meters from getting the ball wide before someone could drift across and tackle them, and full breaks that relied on the fullback or winger dropping back to stop a try. However, that got even more tricky so I just started tracking breaks as basically any big chunck plays where the offense made a defender miss. However I still felt myself leaning towards giving more braks the later into November we got and had to reel myself back in. Now actually looking at the data, Wales gave up a lot of breaks, which makes sense. Argentina surprisingly had a ton of breaks, but that comeback against Scotland was incredible and they had some wicked plays there, and that feels like how you have to beat the English defense. You can't beat them by grinding out yards. You can't rely on them taking a bunch of pens giving you free chunks (they were middle of the pack in defending pens lost). You cetainly can't rely on beating them in an aireal battle, maybe Marcus Smith could be a weakness at 15. But I feel like his high ball struggles are a touch overstated, he's just not the biggest, but basically everyone else in their back three that gets regulat minutes is a master under the high ball. So you have to generate as many breaks as you can, get the ball out wide quickly when they blitz and hope to get around them, then capitalize on that opportunity. In terms of percentage, which I think is the most important one, England, South Africa, and Argentina lead the way. England doesn't shock me, as I've mentioned before they are very good at capitalizing on the broken field they create from kick chase. Their in phase offense isn't the most deadly, but after a kick they have some freakish athletes and rugby brains that know how to take advantage of any extra space. Then of course South Africa. They have refined the blitz defense so well that they just don't give up any breaks and have an attack that clicks very quick sometimes to just cut through an opponent. And by an attack I do mean Sascha, the amount of individual breaks he had by just ghosting through a defense, running a perfect line to split two defenders who were slightly out of line or cut around someone expecing a pass was just insane. Obviously he had help because the defenders had to respect everyone outside of him as well, and his playmaking ability, but he's an incredible talent. Then Libbok can come on and generate breaks for days as well through his kick passes and the way he can manipulate a defense to a tee. Scotland, Wales, Japan, Fiji, and Italy having the fewest breaks is very unsurprising to me. They are most of the bottom teams in the series, and you need breaks to win. Italy obviously beat Australia, but as we've seen already, they didn't rely on great attacking play to beat them, just taking advantage of every single time they could get points. Then Scotland is also arguably a good team (though good teams win games), but they did play 2 tough games, and 2 games that I didn't track. If they had played Fiji or Japan instead of Tonga or the USA I would have liked to see how they did.
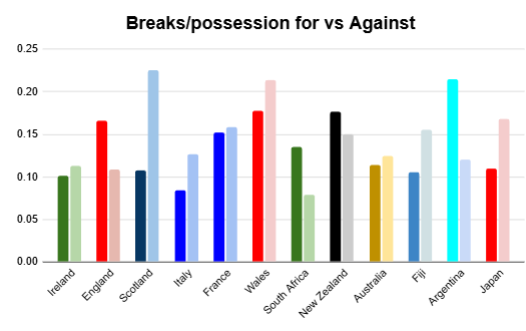
Looking at it in terms of per possession, the Scottish and Welsh defenses were very poor, and the Argentinian offense was incredible. I would say there is certainly some causation there considering their schedules. Wales' attack however was looking very good. Obviously they got a lot of broken field to work with in the ABs game, but they generated some of their own breaks as well. I think this goes back to what I was saying earlier about them playing a more expansive game to get the young kids opportunities to fire shots. Learn what works and what doesn't at an international level while winning doesn't really matter. Then you can refine your attack to only what works which would then hopefully give less turnover ball to the opposition so you can start building up the rest of your game. There is a way back to contention here for Wales. Not an easy short term one, but the situation isn't utterly hopeless (unril the WRU steps in again). I've already discussed the English kicking based attack, and the Kiwi's incredible ball handling leading to the occasional break here or there. I heard a lot about the All Black lack of structure and questionable attack, and while I don't think they had the absolute best attack they could have, they were still near the top in terms of breaks generated. Then the French, I haven't discussed them hardly at all in this article it seems. They've just been near the middle in everything, but here they are near the top in both breaks for and against. They did play a very open game, especially against Fiji and Australia, where basically every other possesion had at least one break it seemed. I think they are still comfortable playing that way with Jailibert, Ntaimack, LBB, Peneaud, and Ramos all bursting through in the back line, but adding Dupont to the mix really takes them to the next level. Someone that can organize all of the chaos to hopefully limit their turnovers and also draw in a lot more of the focus of the defense to the area surrounding the ruck to give the rest of that line more space to work with. Obviously Lucu is very good as a distributer and game manager, however he isn't as big of a threat around the breakdown as Dupont. Also was an interesting stylistic difference between those two games and the South Africa game where it was played like a tight cagey chess match for most of the game. That style suits South Africa far more than France, but the is how France seemed to want to play that game. I know they lost playing their style last time they played the Boks, but that doesn't mean throw it out and try to beat them at their own game. It's their own game for a reason, they're the best in the world at it. Regardless of how you play you can't expect to beat the Boks every time you play them. There were just a ton of questionable decisions from Galthie surrounding that match.

Successful phases is a better measure than successful passes from earlier, because every phase either ends in a turnover/penalty, knock, try, held up, in touch, or another phase. The only bad results there are being in touch/held up, knocking the ball on or throwing a forward pass, or conceding a turnover or penalty. I deemed a "successful phase" to be any phase that didn't result in one of those things. Obviously that will be most phases, but the spread of where teams landed was still somewhat distinct. Obviously this chart starts at 0.75, so the differences will be exaggerated a bit, but I feel like there is a very large difference in 80% of your phases being successful and 85%. However, this broadly follows trends we've seen throughout this article. Italy really struggled to maintain possesion for long stretches of time, while the all blacks were incredible at it. Maintaining possession on almost 95% of phases gives a team such an advantage when it comes to the number of shots they can fire. Inversely for Scotland, onyl regaining possession on 5% of your opponents phases just means they know they have to soak up attacks constantly. Defenders have to keep getting back up on their feet to make tackles. I wonder if that fatigue set in caused the Argentinian comeback, and the last few New Zealand scores to seal that win. Especially after the 50/22 in that game, I could see how knowing you're going to have to make another lengthy defensive stand while running out of time could become demoralizing. I did also filter out kicks from this, so that probably brings both England and South Africa down a bit. Seeing those two so low did surprise me, but they do both rely on their kicking game.
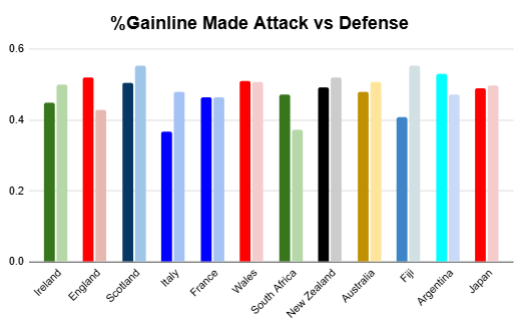
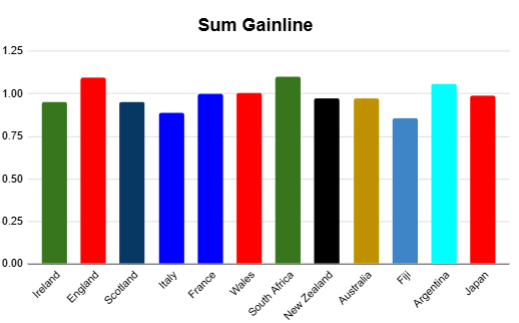
I also tracked whether team made the gainline on each of their phases, which did get tricky sometimes and there was certainly a learning curve throughout the month, but I feel like I did a pretty good job of estimating it. Which gives a generaly estimation of which team brought the better power game and won more collisions. Their defense is just brutal, winning over 60% of their collisions and single handedly ruining Italy's gainline% for this series. They didn't make the most meters offensively, but a lot of that was skewed down by a few phases where they were running pick and goes on the goal line until they got advantage. Usually if they stayed at basically the same spot for multiple phases in a row I would give them one every other phase to keep them around 50%. Them and England being well over 100% were unsurprising, it takes power to win games and those two won a lot of games. Argentina being up there as well is interesting, they've been near the top of a lot of stats, but I feel like have been generally underwhelming this Autumn/TRC. Fiji being the lowest isn't shocking, their defense is pourous and doesn't front up well against England or France, and their attack either makes a lot of meters or gets pushed back a bit often, a tough way to win games despite being fun to watch. Wales being 0.002% better than France is funny how identical they were, and just odd, I have no real analysis on that part, but they're both at almost exactly 100% bang average. France with the better defense and Wales with the better attack.
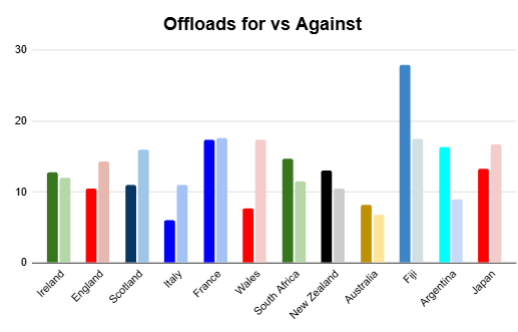
I already wrote a bit about offloads and the risk/rewards of them on my twitter (here) so I'll keep this relatively brief. Fiji (as is their sterotype) chucks the ball around a ton, keeps it alive when every other team would just settle for the next phase, but they also invite more of an open game with even England throwing some offloads when they played. Obviously France throws their fair share as well in general. Then Argentina, throws a good amount but are very good at either preventing them with chop tackles and wrapping the arms, or just played teams that didn't want to throw them. I'll have to watch more of that next time they play. Wales is not a big offloading team, which makes sense, a lot of new combinations, they don't know where everyone else will be on the pitch as well as other teams do, yet.
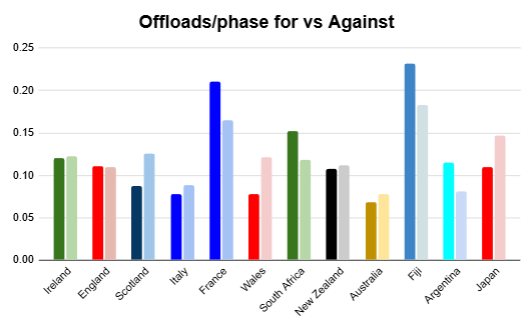
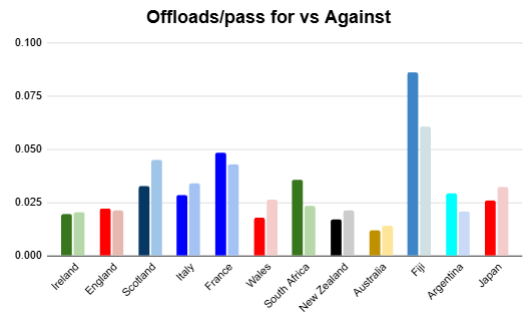
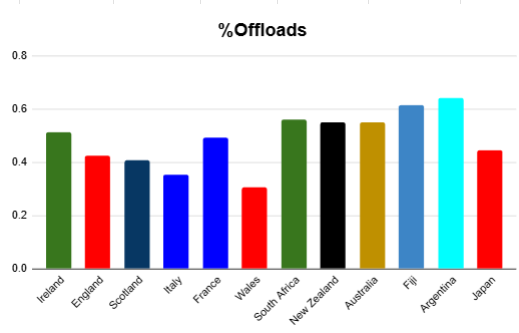
When you look at it per phase run, Fiji and France really explode. Both teams love keeping the ball alive and trying to get that extra break. Then Italy and Australia both collapse, barely throwing any offloads. Again, that makes sense, they both wanted to play tight and not do anything too aggressive or risky in their games. Italy just wanted to win pens and kick 3s. Australia just had a very disorganized and almost lazy attack. Their shapes seemed basic and plays were largely just getting the ball through the hands somewhat slowly. Considering how big league is in Australia, and how important keeping the ball alive there is, one would think they would be a team that throws more offloads in union too, especially with Sua'ali'i. But instead they were near the bottom, and a few of their offloads were guys who were wrapped up and being driven back just handing it off to a guy who could get down easier. Then probably the silliest stat is that the percent of Fiji's passes that were offloads isn't that far off 10%. Then there were teams around 1%...
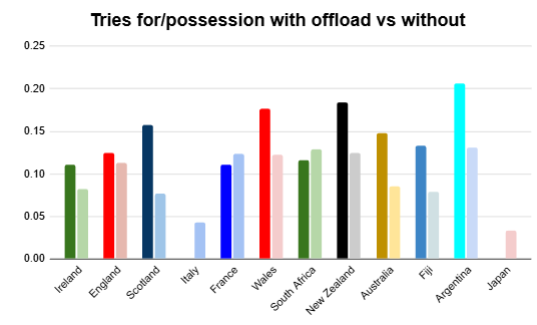
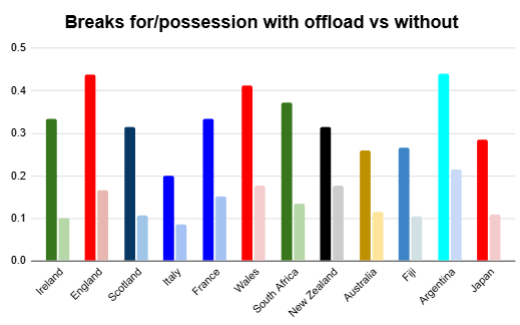
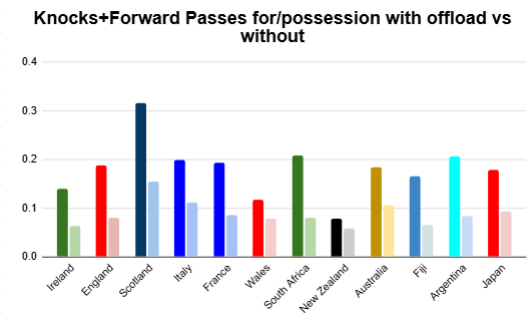
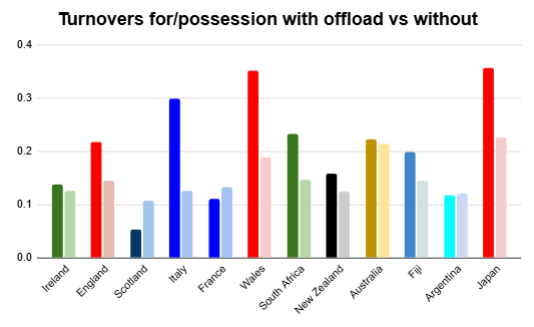
Now for the risk/reward analysis of offloads in rugby. Every team other than France and South Africa that had a competent try scoring offense (sorry Italy and Japan) scored more tries on phases with an offload than without. Simple then, offloads are worth it, they generate more tires, and a LOT more breaks, almost doubling the chances of that possessino having a break in it. Every offload draws more defenders into the breakdown area, or allows a new runner to "appear" mext to the current defenders running a new line at a new angle and get the break themselves, so that makes sense. I would also encourage teams like England that really thrive on and try to get as much broken field play as possible to consider trowing more offloads if possible. What also stood out to me was that France threw a ton of offloads, but scored fewer tries on those possessions than just their normal offense. Obviously this is a relatively small sample size, but maybe they should just focus more on getting LBB the ball in normal ways because he seems to know what to do with the ball regardless of the time or space he has. However, every additional potential reward has risks to go along side it as each offload you throw you increase the chance of there being a forward pass or knock on. Forwards passes and knock ons roughly double for most teams, except New Zealand, who, as I've been saying, has the best ball handling ability in the world, and Wales, because of course Wales threw a bunch of successful offloads. Then turnovers really shoot up for some teams, Wales or Italy, but remain relatively constant for teams that are probably more well drilled in ball support and throwing those offloads, like Australia and New Zealand. Then Scotland, France, and Argentina actually turn the ball over more on phases where they don't offload the ball, which really surprised me to see because I included every possession in this. Even possessions where they kicked on first or second phase, which happens frequently. I think a better measure would be to look at only possessions with 3+ phases and an offload vs 3+ phases without an offload. Both of those show there was some attacking thought in the possession and not just a pure territory kick it back play. However there were a lot of offloads thrown on first and second phase. Some teams have set piece moves with addition supoort runners coming in as secondary strike runners that expect an offload to take advantage of the additional space like in 7s. Also, this just confuses me even more with France. Why do they throw so many offloads, score fewer tries but also turn the ball over less, but then they get a lot more breaks and knocks, probably just an issue with the small sample size, but still quite funny and odd. Certainly a thing I will be looking out for during the 6 Nations.
Looking at the defensive side quickly, South Africa has an insane defense. Argentina barely gives up any offloads, but it was very punishing when they did. Ireland's defense also fronted up well overall, though some weaker competition didn't hurt them. Then basically every team gave up a lot more breaks when their opponent threw an offload, with Scotland giving up a break on almost 50% of those phases, which is very significant. However, as we looked at earlier, breaks lead to a lot more action. Definately more tries for the attacking team, but also certainly more unsupported runners and tunrovers and attacking play for the defending team as well, if they can scramble in the first place. Then, as expected, basically every team other than Scotland and Argentina saw an approximate doubling of opponents knocks and forwards passes when they faced an offload. Most teams were also able to punish their opposition with more turnovers when they played more attacking rugby and threw an offload. Except France. Again. I really don't know what they do in games with offloads, and why it always counters the trends. And Australia too, but they played France, who as we said are very weird, and Ireland+Italy, who don't like throwing offloads in the first place. Italy was very opportunistic though, as was their gameplan, turning 33% of opponents phases with an offload into a turnover.
My conclusion from all of this discussion on offloads is that they are matchup dependent. Obviously a team like Fiji is going to throw a bunch of offloads because that's how they play. But with "normal" teams, take England for example, they love to play with broken field because of their attacking threats in the backline. Throwing offloads is a great way to generate broken field attack. Say they're playing Argentina, who really struggled with defending an offload this autumn, they gave up a lot more tries and breaks, but barely won any more penalties. If I'm England in that matchup, I'm trying to throw as many offloads as possible. Though I suppose England doesn't really need any more help in that matchup. However, if I'm playing Italy, who clearly had a great scramble defense and barely gave up any more tries when the opponent threw an offload, it probably isn't worth the additional risk of potentially giving them 3 points because they were very good at turning broken field defense into turnovers, and very good at turning those turnovers into PKs. Obviously take all of this analysis with a grain of salt, there were only 19 games played, so these aren't long term trends, and because teams played imbalanenced schedueles, some of these stats may not hold during the summer tours or 6 nations, even before we consider changing team compositions and different strategies from coaches coming into matchups, but I thought this was a fun look into offloads that I will continue to look at.
Having tracked a decent amount of games by now, I feel like I have learned a good bit more about rugby, and what I want to track next time I get around to doing this. Which will probably be the 6 Nations, unless I have a lot more free time than I expect and want to track the Champions Cup. But there are just so many of those games, I don't think I'd have time to track all of them. But the main thing I want to do is focus on better start and end of possesion tracking. Track how and where each possession started (scrum on defending 35, attacking 5m lineout, tap play under the sticks, kick reception on midfield etc) and ended, in more detail. Maybe not necissarily the location, but certainly splitting up turnovers into pens lost and actual turnovers. Then also probably adding more detail around kicks, at least whether it was regathered or not, then probably what the result was. Clean take, knock on either side, returned kick, etc. Then I could use those start locations to create an "xG" (xTry?) model for each of scrums/lineouts/taps depending on the location where they started. What are the odds of a possession that started with an attacking scrum ending in a try vs lineout in their own half. I discussed this idea with Huw Griffin Rugby on YouTube and said it was probably nott feasible then, but after having done this, I think it is more possible now. I also want better labelling of the "flow" of a game. ie if a team has 3-4 consecutive possesions, I have no way of knowing that with how I tracked the data, and I think it would be incredibly useful information to have. It would be a simple formatting thing in my tracking spreadsheet so I will definately implement that, as well as some other effeciency boosts that I learned along the way in November. Then speaking of things I learned, I should be more consistent with my labelling of breaks, gainline%, and kicks next time I do this, after simply having the experience of doing this once. Then I want to be able to automate a table/chart generations for linebreaks like I did wiht offloads here. I could manually do it for this series, but don't think I can autmate it, but I'll work on doing that for the 6 Nations. I also want to continue doing this for the forseable future to see how teams trends and playstyles change and to build up a big enough dataset that I can start to work with the data to predict success based on the factors I have.
Data
Literally just all tracked myself.